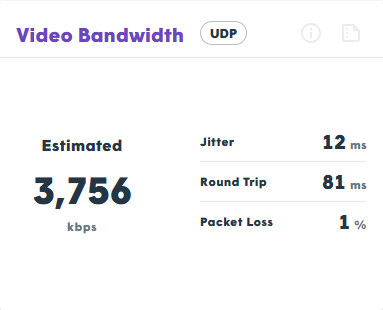
The Video Bandwidth Widget is a diagnostic tool used to measure the video throughput estimation of WebRTC. It simulates a live session to understand how much UDP traffic the network can handle, which is critical for maintaining high-quality video during telehealth visits.
How the Test Works
The test establishes a WebRTC peer connection via TytoCare’s TURN servers. It sends a stream of video data through the connection to determine what the browser estimates as the maximum available outgoing bandwidth.
Note: Bandwidth changes dynamically. This test provides a snapshot of current conditions over a short duration.
Key Performance Indicators (KPIs)
| Metric | Definition |
|---|---|
| Bandwidth Estimate | The total volume of data WebRTC believes it can successfully send in the outgoing direction. |
| Jitter | The variation in packet arrival time. Lower values indicate a more stable connection. |
| Round Trip (RTT) | The time it takes for a signal to reach the server and return. Lower values reduce video lag. |
| Packet Loss | The percentage of data packets that fail to reach their destination. Ideally 0%. |
Critical Success Factors
- Minimize Noise: Jitter, RTT, and Packet Loss should always have the lowest values possible to prevent "choppy" video or frozen frames.
- "Capability" vs. "Usage": The bandwidth estimate represents the network's capacity, not necessarily the actual amount of data being sent at that moment.
IT Administrator Warning: High packet loss or excessive RTT often points to firewall throttling of UDP traffic or a saturated Wi-Fi access point. If these values are poor, consider whitelisting TytoCare TURN server IP ranges.